Shadcn KPI Cards: Deltas, Sparklines and Goal Bars
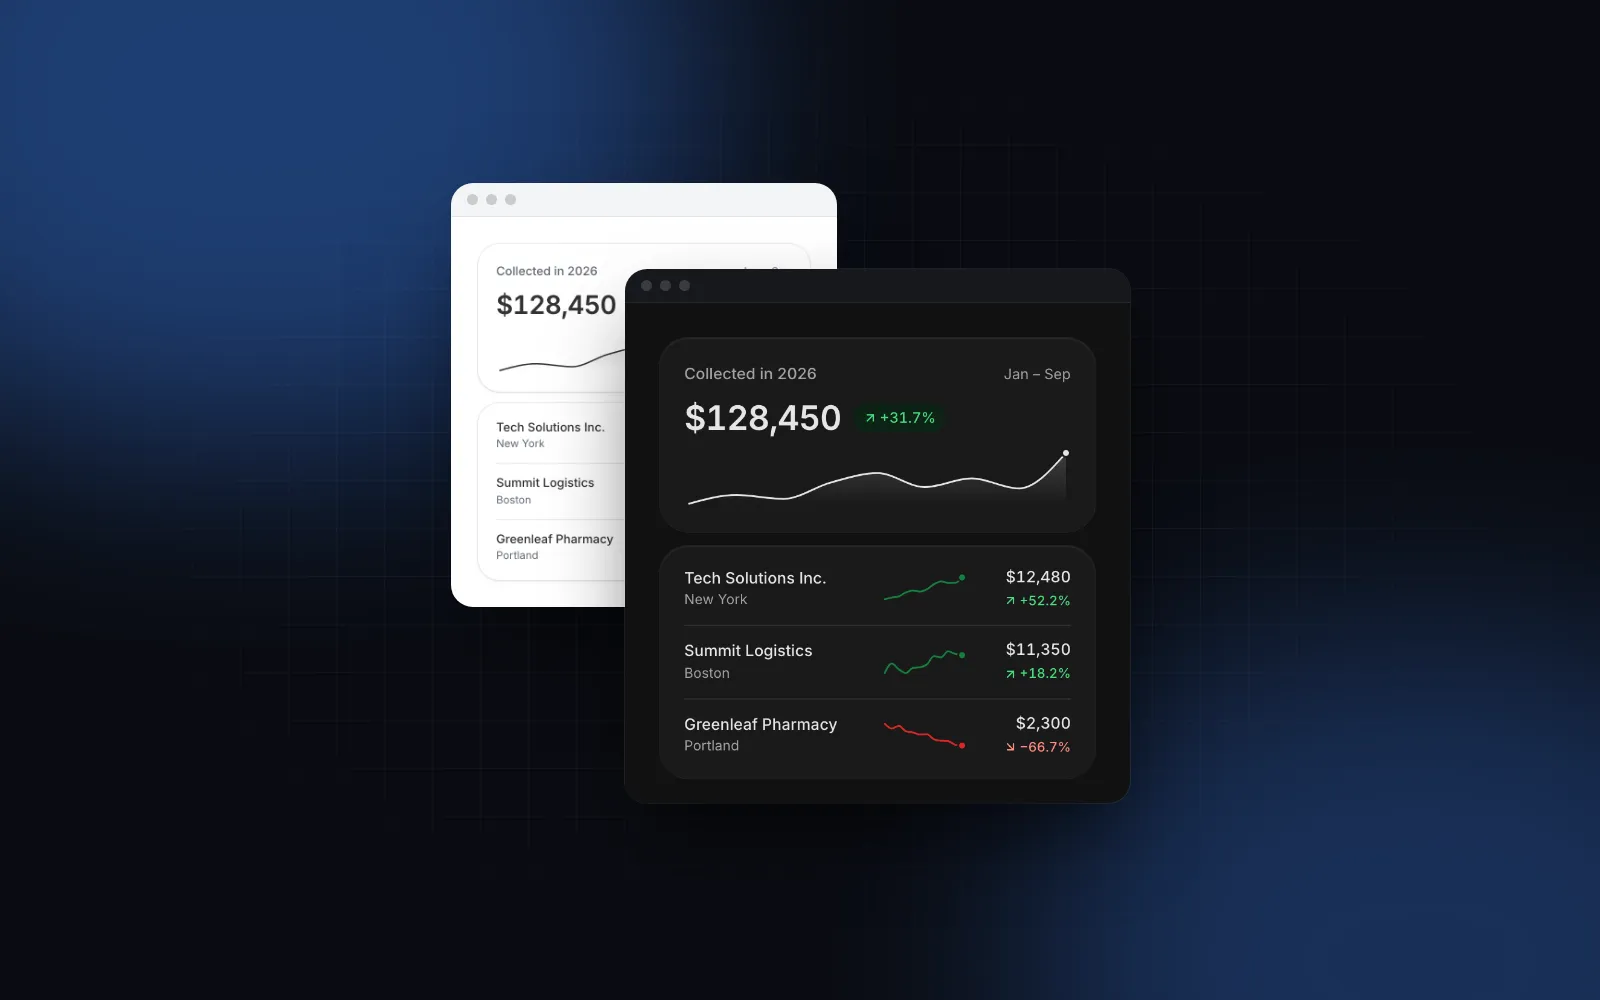
You open a dashboard, see "$128,450" in a tile and still do not know if the month went well. That is the gap most shadcn KPI cards leave open: a number, a label and maybe a badge, with no sense of direction, shape or target. This guide shows what a KPI card needs to answer "is this good?", what the official shadcn block gives you, and how to build shadcn stat cards with the Wingo UI Stat Card, Trend Badge and Sparkline. Then we put them into the full KPI Dashboard block and look at how its grid collapses on phones.
What should a KPI card show?
A KPI card earns its place when someone can read it in two seconds and know what to do next. That takes five parts, each answering a smaller question:
- The label and an explanation. What is this number? "Revenue" is fine; "Net revenue, before tax" behind an info icon is better, because two people on the same team often mean different things by the same word.
- The number, formatted for the reader.
$128,450,2.1%,18 days,128.5K. The format belongs to the metric, and the locale belongs to the reader. - The change and its meaning.
+12.4% vs. last month, green when the change is good, red when it is bad. The color has to follow the meaning, not the sign: a drop in churn is good news. - The shape of the period. A sparkline shows whether a +12% month was a steady climb or one big invoice on the last day.
- The target. A goal bar ("68% of goal") turns a number into progress.
Most cards stop after the first two or three. The last two are what make a row of React KPI cards useful instead of decorative.
What do the shadcn dashboard cards give you?
shadcn/ui has no KPI or stat card component (checked November 2026). The closest thing is the SectionCards file inside the dashboard-01 block (source on GitHub (opens in a new tab), read November 6, 2026). It composes Card, CardHeader, CardDescription, CardTitle, CardAction, CardFooter and Badge, and it is a good starting point for a shadcn analytics dashboard:
- Each card has a label, a hardcoded value like
$1,250.00, an outlineBadgewith a trend icon and a text like+12.5%, and a two-line footer ("Down 20% this period", "Acquisition needs attention"). - The badge looks the same for an increase and a decrease. Only the icon changes, so "-20%" on New Customers is not visually marked as bad.
- There is no sparkline, no goal and no count-up. Values are strings in JSX, so formatting is up to you.
- The grid is one column by default, two from the
@xlcontainer width and four from@5xl.
That is the shadcn way: a pattern you copy and own, and community block collections follow the same copy-and-own model. It works well for a fixed set of four tiles. Once the numbers come from an API, you end up writing the formatting, the good-or-bad color per metric and the loading state yourself, in every card. A component with props moves that logic into one place.
How do I build a KPI card with Stat Card?
Install stat-card, then pass a numeric value, a format, a delta, the sparkline data and a goal: one element covers all five parts. The CLI brings its dependencies along (the counter, progress bar, tooltip and number helpers):
value is a number, format decides how it reads, delta is the change in deltaFormat units (percent by default), and goal adds the progress bar:
$ npx wingo-ui@latest add stat-cardDoes the count-up hurt SEO or screen readers?
No, because the animation only runs on the client. The server HTML and the first paint already contain the final number, so a crawler or a slow phone sees $128,450, not $0. The number counts up from zero once, the first time the card scrolls into view (900ms by default, set with duration), and later changes count from the number on screen. Screen readers hear one sentence with the final value and the change, such as "$128,450, up 12.4% vs. last month", never the numbers in between. Under reduced motion the numbers and charts appear final at once. For live numbers that tick, animation="roll" uses an odometer instead, and animation="none" turns it off.
How does the delta know good from bad?
The arrow follows the sign of delta; the color follows the meaning. By default a rise is green and a fall is red. Add invertTrend for metrics where down is good, like costs, churn or response time: a drop turns green and the arrow still points down. The tone prop colors the icon tile, the sparkline and the goal bar, but never the delta, so a brand-orange card cannot accidentally make bad news look neutral.
The same logic is a standalone component, TrendBadge, for table cells, leaderboards and your own cards:
The file needs "use client" because formatValue is a function, and functions cannot cross from a Server Component into a Client Component as props.
$ npx wingo-ui@latest add trend-badgeWhen do I use the standalone Sparkline?
Use the standalone one when a reader needs to inspect the points, or when the chart lives outside a card. Stat Card has a built-in sparkline (sparkline for the data, sparklineType for line, area or bar), and stat-card.tsx also exports that chart as Sparkline for simple cases. The separate Sparkline component goes further: win / loss ticks (type="win-loss"), min and max markers (showMinMax), a dashed reference line at the first value, the average or zero, trendColor to color by direction, and interactive mode where you hover, drag a finger or use the arrow keys to read each point. Use it in table rows, or pass it to a card through the chart prop when you need those extras:
Both files export a component named Sparkline, so import the standalone one from @/components/ui/sparkline and alias it if a file needs both.
How do I lay out a row of React KPI cards?
Wrap the cards in StatGroup. It is a list (role="list") with responsive columns: two on phones and four from 1024px by default, changed with columns={{ base, sm, lg }}. The tiles count up 60ms apart (turn it off with stagger={false}), and variant="joined" draws one panel with hairlines between the tiles instead of separate cards.
Three details in that code matter. The file is a Client Component because formatDelta is a function prop. Churn uses formatDelta because a change in a percentage is percentage points, not percent: going from 2.5% to 2.1% is "−0.4 pts", and printing "−0.4%" would be wrong. Durations take seconds, so format="duration" prints 4 hr and the delta prints 30 min. Pass loading while the data is on its way and each card shows skeletons at the real sizes, so nothing jumps when the numbers land.
What does a full React KPI dashboard look like?
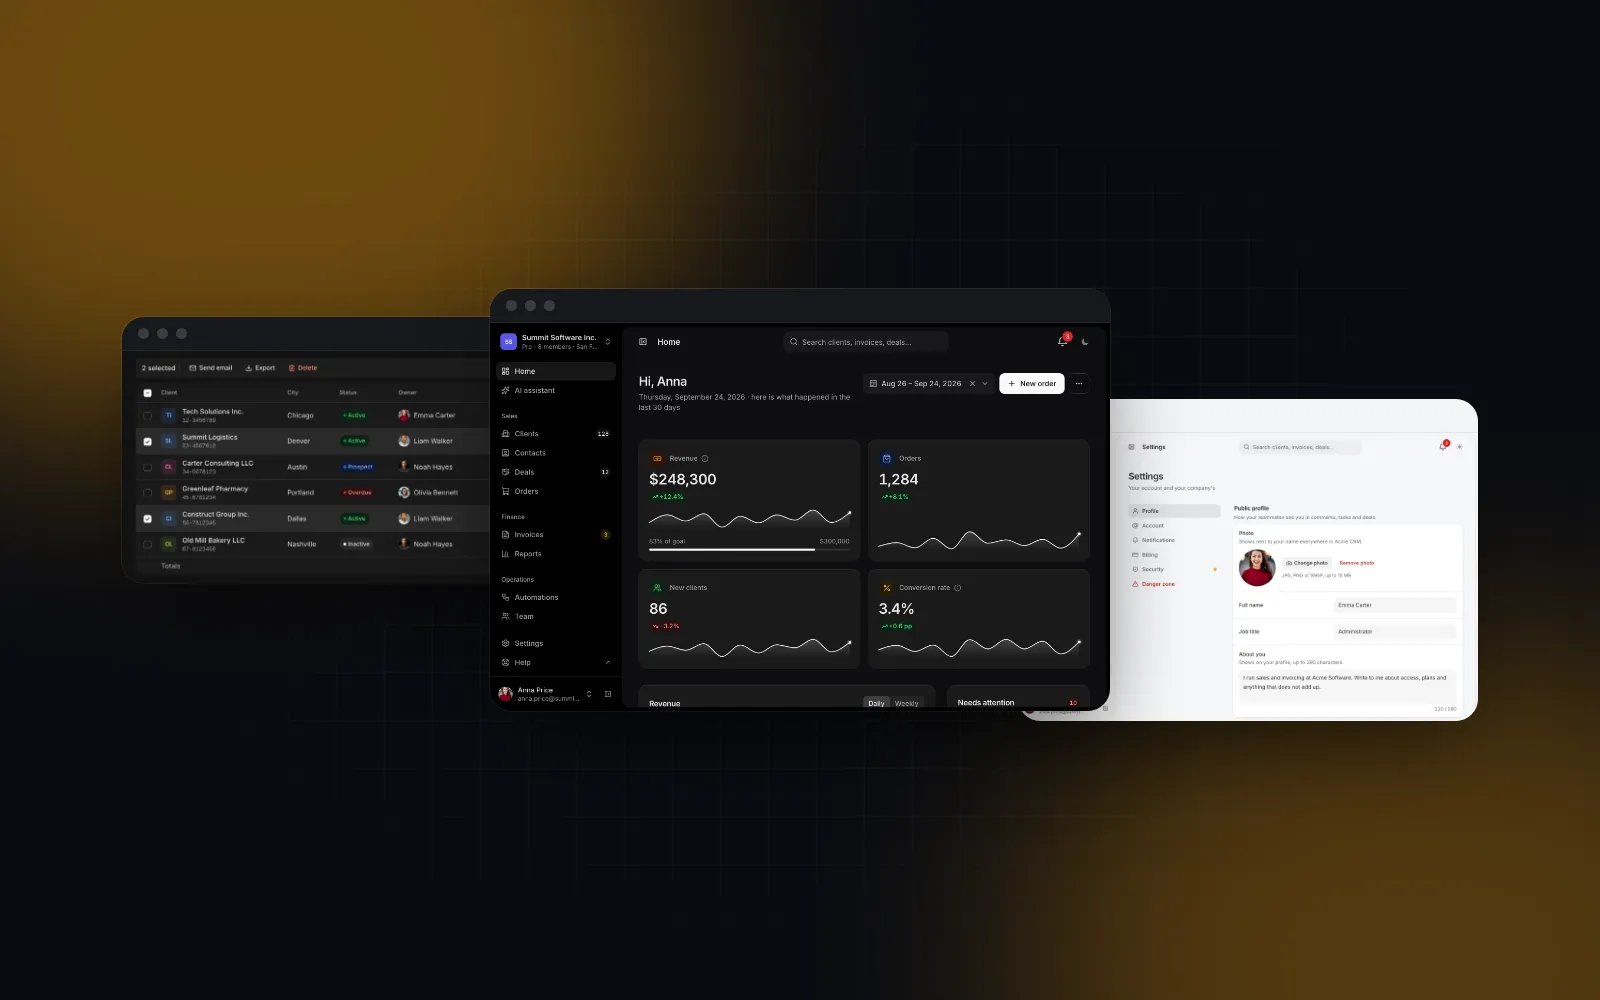
A full dashboard puts the KPI tiles on top and the widgets under them, and the KPI Dashboard block ships that whole screen: revenue against the previous period, revenue by month or city, sources, a funnel, top sellers, the latest invoices and an activity feed. The header has a period picker with presets and a compare switch that turns the dashed previous series and every delta on and off. Refresh and export buttons appear when you pass onRefresh and onExport.
The block shows data; fetching it for a period is your app's job. onRefresh can return a promise: the button spins until it settles and then announces the update time. Each item in data.kpis is a KpiItem with the same ideas as Stat Card: value, format, delta, deltaFormat (including points for percentage points), invertTrend, sparkline, goal, info and href. In the sample, Outstanding is $31,650 with a +4.1% delta and invertTrend, so the rise in money owed shows red.
$ npx wingo-ui@latest add kpi-dashboardHow does the KPI grid collapse on phones?
The dashboard measures its own width with container queries, not the viewport, so a sidebar never squeezes it into a broken layout. With the default kpiColumns={0} (auto):
The latest invoices switch from a table to cards whenever their widget is narrower than 672px. On a phone the header actions also fold: refresh and export move into one ⋯ button that opens an action sheet, and the period picker opens as a bottom sheet instead of a popover. StatGroup alone uses viewport breakpoints (two columns base, four from lg), and at the md size the values shrink so a currency figure still fits a 360px screen. Two per row is the right phone default: one per row turns four KPIs into a full screen of scrolling, and three leaves each tile about 100px of a 360px screen for a figure like $128,450.
What are the common KPI card mistakes?
Most mistakes make a card look precise while it misleads the reader:
- Coloring by sign. Red for every drop makes "costs down 8%" look like a problem. Decide per metric whether down is good.
- Comparing different periods. "+12% vs. last month" on September 15 compares half a month with a full one. Compare with the same days of the previous period, or label the partial period.
- Mixing percent and points. A conversion rate going from 20% to 23% is +3 points, or +15%. Pick one and say which.
- Showing 0 when there is no data.
nullshould print a dash ("–"), not$0, which reads as a real and very bad month. - Counting up on every refresh. Animate once; afterwards move from the old number to the new one, or people stop trusting the figures.
For the chart side of a dashboard, see React charts with Tailwind and, for sparklines in table cells on one shared scale, React sparkline, and for a whole admin app with tables and settings around these cards, the Next.js admin dashboard tutorial. If you are still choosing a library for the whole dashboard, read the best React component library for dashboards. More guides like this one are in component guides, and the React form components guide is the pillar for that series.
What should I do next?
Open the Stat Card docs and try the props in the playground; the docs, props and live demos are free to use without an account. Stat Card, Trend Badge, Sparkline and the KPI Dashboard are part of Pro ($8 a month, $80 a year or $150 once, see pricing), and a free account gets you the source of every free item if you want to start with the basics.
FAQ
Does shadcn/ui have a KPI card component?
No. As of November 2026 shadcn/ui has no KPI or stat card component. Its dashboard-01 block includes a SectionCards file that composes Card and Badge with hardcoded numbers, and you edit that file for your own metrics.
How do I show a decrease as good in a React KPI card?
Separate the arrow from the color. The arrow follows the sign of the change, and the color follows the meaning: for costs, churn and response time a drop is positive. In Wingo UI that is the invertTrend prop on StatCard, TrendBadge and Sparkline.
How many KPI cards should a dashboard show?
Four to six in the top row is a common choice, because more tiles get too narrow to read on a laptop and push the charts below the fold. The KPI Dashboard puts up to six tiles in one row from 1024px of its own width and wraps more than that into several rows.
How should KPI cards behave on mobile?
Two cards per row is the usual phone layout: one per row wastes height, three gets too tight for a currency value at 360px. Make the last tile span the full row when the count is odd, shrink the number to fit, and keep the delta and label readable.
Should KPI numbers animate?
A short count-up on first view helps the eye land on the numbers, but the server HTML and screen readers should get the final value, and reduced motion should skip it. Later updates should count from the number on screen, not from zero.
- Dashboard
- KPI
- Charts
- shadcn