React Funnel Chart: Conversion, Drop-off and Cohorts
Your product has a signup flow, a checkout or a sales pipeline, and someone asks where people get lost. A React funnel chart answers that question, but only if it shows more than a cone of colors. Most React funnel graph examples you find draw five trapezoids with fixed widths and a label in each, which looks right and says little: you still have to do the math to learn that 60% of qualified leads never got a proposal. This guide covers what a funnel chart should print, when to draw aligned bars instead of a tapered shape, which libraries exist, and how to build one with the Wingo UI Funnel Chart.
What should a conversion funnel chart show?
Three numbers per step, all printed on the chart:
- The count. 1,240 leads, 620 qualified, 248 proposals sent.
- The conversion. The step's value as a share of a baseline. Against the first step it tells the overall story ("3.3% of leads were won"). Against the previous step it isolates one transition ("40% of qualified leads got a proposal").
- The drop-off. What the previous step lost on the way: (previous - current) / previous, in percent and in units. "60% drop-off, 372 lost" is the sentence people act on.
The drop-off between steps is the reason a funnel exists. If you only print the counts, the reader divides in their head, and nobody does that reliably for five steps.
Bars or a tapered funnel: which is more honest?
Aligned bars, in most cases. Every step gets a row with its label, its count and its conversion, and a bar on a shared track that starts at the same left edge. Lengths that share a baseline are easy to compare, so 248 against 96 reads at a glance. The rows also fit a 360px phone without any change.
The tapered shape has two problems. The eye compares the area and slope of each trapezoid, and both depend on the next step's value. And many funnel designs do not scale the widths at all. MUI X documents this directly: its funnel sections use a band scale with equal widths by default, and you set scaleType: 'linear' on the category axis to make the width follow the value (MUI X Funnel docs (opens in a new tab), November 2026).
A tapered funnel still works as a headline tile, as long as the widths follow the values and the numbers sit beside the shape.
Which React funnel chart libraries exist?
Five are worth knowing: Recharts (free, MIT), MUI X Charts Pro (paid), ApexCharts (free for small organizations), KendoReact (a commercial suite) and the small react-funnel-pipeline package. shadcn/ui has none. Each row below was checked on November 6, 2026 against the project's docs, pricing page and npm entry.
If you were looking for a shadcn funnel chart: the official shadcn/ui chart gallery is built on Recharts and lists area, bar, line, pie, radar and radial charts, with no funnel (ui.shadcn.com/charts (opens in a new tab), November 2026). If your app already uses Recharts, its Funnel is the free path and you add the drop-off labels yourself. If you already pay for MUI X Pro, its funnel fits your theme with no new dependency. If you want the three numbers per step, keyboard access and a phone layout without writing them, that is what the Wingo UI component does.
How do I build a React funnel chart with Wingo UI?
Install it with the CLI. It copies the source into your project with the chart kit it imports:
Pass the steps in order, widest first. Each step needs an id, a label and a value:
That renders the default variant="bars": one row per step with the count, the conversion against the first step, and a chip between rows with the drop-off and the number lost. Bar lengths are the value divided by the largest value, so they are always to scale.
Try the period switch in the panel below: the bars glide to August's lengths and every chip updates.
$ npx wingo-ui@latest add funnel-chartThe props you will reach for next:
variant:barsorfunnel(the tapered shape), withorientation(verticalorhorizontal) andcurve(linearorsmooth) for the shape.baseline:first(the default) orprevious, for what the conversion percent is measured against.dropoffThreshold: drop-offs from this percent up print in the danger color. The default is 10;0turns the color off.valueFormat:number,compact,currencyorpercent, withcurrencyandlocale, orformatValuefor full control.onValueChangeoronStepClick: passing either one turns the rows into buttons, for example to open the deals in a stage.
How do I find the biggest funnel drop-off?
Switch the baseline to the previous step and raise the threshold. Against the first step every later percent is small, so the weak transition hides. Against the previous step each row shows its own pass rate, and the threshold marks only the losses that need attention:
In the September pipeline that leaves two red chips: 60% lost between qualified and proposal, and 61.3% between proposal and negotiation. The first step shows no conversion, because there is nothing before it.
$ npx wingo-ui@latest add funnel-chartFor the tapered look, set variant="funnel". Hover a segment, or tap it on a phone, to read its value, conversion and drop-off in a readout; drag a finger along the shape to scrub. A horizontal funnel stacks top to bottom in containers narrower than 480px.
$ npx wingo-ui@latest add funnel-chartWhy is a funnel honest only with consistent cohorts?
Because the percentages assume that the people in step 3 are a subset of the people in step 2. That is true when you follow one cohort, for example everyone who became a lead in September, through every step. It stops being true when:
- Steps count events instead of people. A visitor who opens the cart three times adds three to "Cart" and one to "Visits".
- Steps use different date windows. September's proposals include leads from August, so the conversion from qualified to proposal is inflated by last month's work.
- People enter in the middle. A newsletter click that lands on a product page skips the earlier steps.
- The window is still open. A cohort from last week has not had time to close, so the last step looks like a collapse.
Any of these can push a later step above the one before it. The Wingo UI chart does not hide that: a step larger than its predecessor gets a gain chip (for example "15.9% gain, 62 more") instead of a negative drop-off, and a step at 0 keeps its row. Treat a gain as a data question before you treat it as good news. Give the chart a label that names the cohort ("Leads created in September 2026") so readers know what they are looking at.
What goes next to a funnel chart on a dashboard?
A stat card for the trend and a bar chart for segments. The funnel answers "where do people drop off"; two other questions usually sit next to it on the same dashboard.
"Is it getting better?" Put the overall conversion in a Stat Card above the funnel, with the change against the previous cohort. Conversion rates change in points, so print the delta as points:
The "use client" line is there because formatDelta is a function, and a Server Component cannot pass a function to a Client Component.
"Which segment converts best?" Five funnels side by side are hard to compare. Pick the one rate that matters and compare it across channels or months with a Bar Chart; horizontal bars keep long channel names readable on a phone:
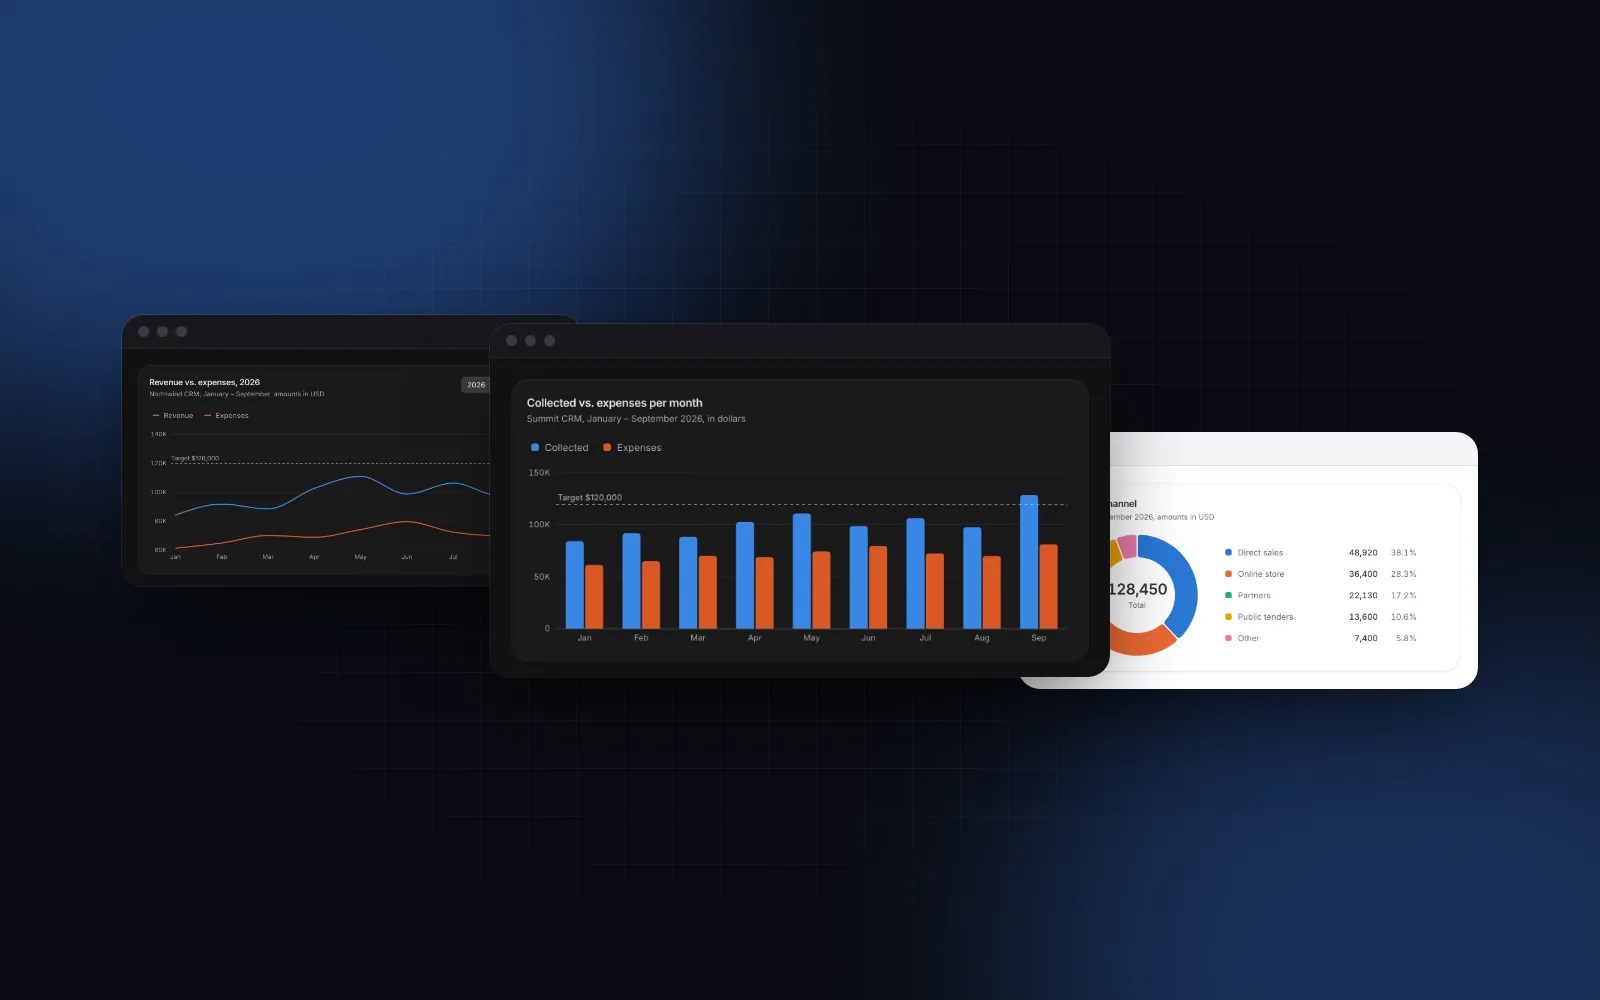
All three charts share the chart kit (palette, number formatting, screen reader table), so a percent prints the same way everywhere. The KPI Dashboard block puts a funnel, stat tiles and bar charts into one screen if you want the composed version. For the rest of the chart set, see React charts with Tailwind and the shadcn KPI cards guide.
How does it work with a keyboard, a screen reader and a phone?
The chart is a figure whose accessible name adds the overall conversion to your label ("Sales pipeline, September 2026, 3.3% overall conversion"), and description adds a one-sentence takeaway. Each row carries a hidden sentence with all three numbers, and a screen reader table lists every step. When the rows are buttons they form one tab stop: Up and Down move between them, Home and End jump to the ends, Enter or Space selects, Escape clears. The funnel variant adds a live region that reads each step as you move.
On a phone the bars variant needs no special layout: rows are full width and selectable rows grow to 44px targets on touch screens. Prefer bars below 480px; a tapered shape squeezes its labels into a narrow column.
What are the common funnel chart pitfalls?
Three come up again and again:
- A funnel for unordered categories. Traffic by source has no sequence. Use a bar chart or a donut.
- A danger color on every chip. With five steps and the default 10% threshold, almost everything turns red. Raise
dropoffThresholdto the loss that would make you act. - Animation in exports. Pass
animated={false}for thumbnails, PDFs and screenshots.
How do I add it to my project?
Run npx wingo-ui@latest add funnel-chart, then add stat-card and add bar-chart if you want the full set. All of them are Pro items: Pro is $8 a month, $80 a year or $150 once, with the details on the pricing page. You can try every prop first in the playground on the Funnel Chart docs page. More single-component guides are in the component guides category.
FAQ
How do I make a funnel chart in React?
Pass an ordered list of steps with an id, a label and a value to a funnel component. With Wingo UI that is , installed with npx wingo-ui@latest add funnel-chart; it computes the conversion and the drop-off for you.
How do you calculate drop-off in a funnel chart?
Drop-off is the share of the previous step that did not reach this one: (previous - current) / previous. From 620 qualified leads to 248 proposals the drop-off is 60%, and 372 leads were lost.
Should conversion be measured against the first step or the previous one?
Against the first step when you want the overall story (3.3% of leads became customers), against the previous step when you are hunting for the single weakest transition. The Wingo UI FunnelChart switches between the two with baseline="first" or baseline="previous".
Does shadcn/ui have a funnel chart?
Not as of November 2026. The shadcn/ui chart gallery is built on Recharts and lists area, bar, line, pie, radar and radial charts, so the closest path is the Recharts Funnel component, with the drop-off labels written by hand.
Why does my funnel show a step bigger than the one before it?
Usually because the steps count different groups: events instead of people, different date windows, or users who entered in the middle. Count one cohort through every step; the Wingo UI FunnelChart prints a gain chip when it happens so the problem stays visible.
Is the Wingo UI Funnel Chart free?
No. The Funnel Chart, Bar Chart, Stat Card and the chart kit they share are Pro items. The docs pages and live playgrounds are open to everyone.
- Charts
- Funnel
- Dashboard
- Analytics
- React